What Is the Debt-to-GDP Ratio, and Why Does 100% Matter?
ALT: Debt-to-GDP ratio explainer chart showing 100% threshold and government debt levels
For educational purposes only. Not investment advice.
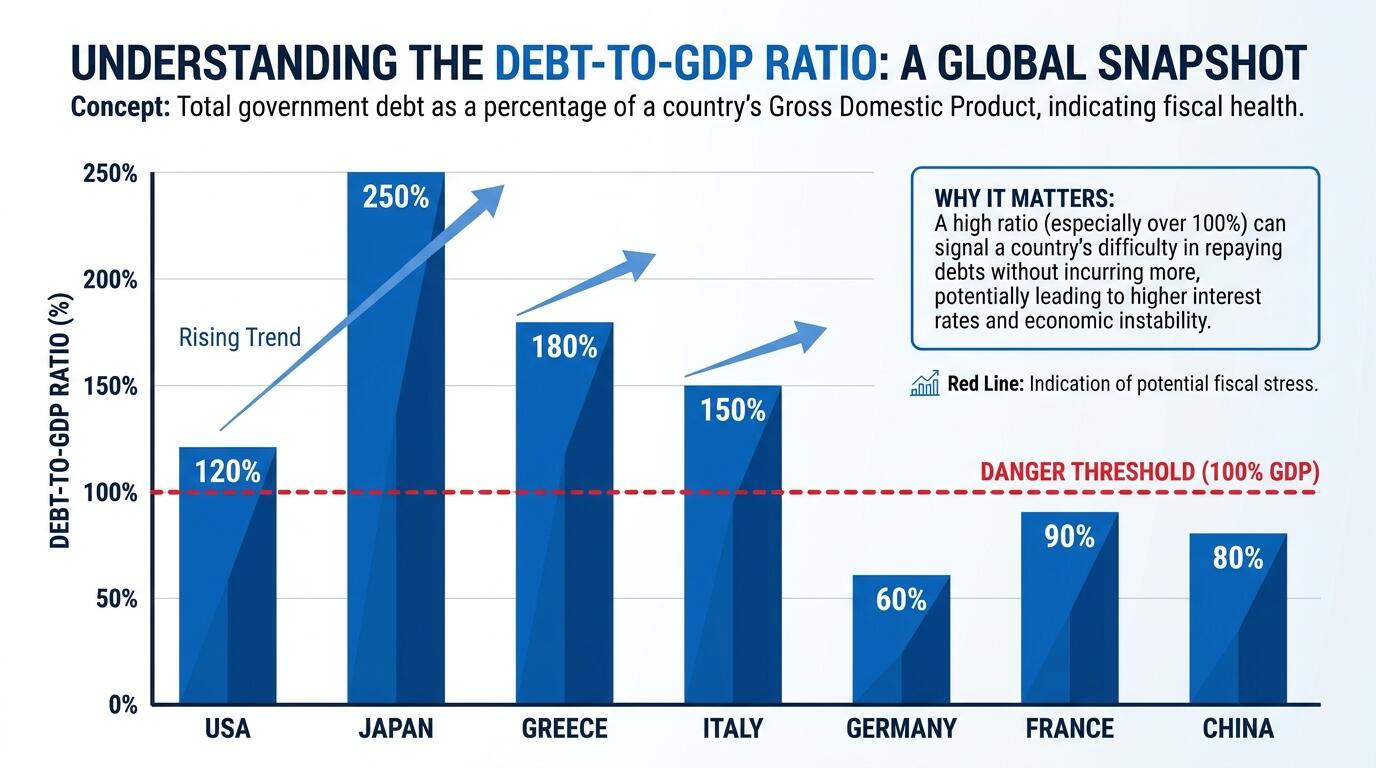
ALT: Debt-to-GDP ratio explainer chart showing 100% threshold and government debt levels
Why the Debt-to-GDP Ratio Is One of the Most Watched Numbers in Economics
The debt-to-GDP ratio is a measure of a country's total government debt expressed as a percentage of its annual economic output, and it tells you, in a single figure, how heavy a nation's financial burden is relative to its ability to generate income. You've probably seen headlines warning that a country's debt has "surpassed 100% of GDP" — but if you've ever wondered what that actually means for you, your taxes, or the broader economy, you're not alone. That threshold carries real weight among economists, policymakers, and market analysts, and understanding why it matters is one of the most useful pieces of financial literacy a curious reader can pick up.
In a period when government spending surged globally following the pandemic and interest rates climbed sharply afterward, debt-to-GDP ratios across major economies have reached levels not seen in generations. This makes now an especially important time to understand the metric — not because it predicts a crisis automatically, but because it shapes the policy choices, borrowing costs, and economic trade-offs that touch everyday life in ways that aren't always obvious.
The State of Government Debt Today: How We Got Here
The debt-to-GDP ratio has climbed steadily across many of the world's largest economies over the past two decades, driven by a combination of financial crises, pandemic-era stimulus, aging populations, and persistently low-tax, high-spend political environments. Understanding where countries stand today requires a brief look at how that trajectory unfolded.
Before the 2008 global financial crisis, many advanced economies maintained debt-to-GDP ratios that economists broadly considered manageable — often below 60% to 70% of GDP. The financial crisis changed that picture dramatically. Governments injected enormous sums to stabilize banks and support households, borrowing heavily in the process. Recovery was slow, and debt levels never fully retreated before the next shock arrived.
The COVID-19 pandemic, beginning in 2020, triggered the largest coordinated government spending response in modern peacetime history. According to the International Monetary Fund (IMF), global public debt surged to record highs during this period as governments funded health systems, income support programs, and economic rescue packages. For many countries, including the United States, that meant debt-to-GDP ratios crossed or approached the 100% mark — or well beyond it.
The United States is a prominent example. The U.S. federal debt held by the public, as tracked by the Congressional Budget Office (CBO), has grown substantially as a share of GDP and is projected to continue rising under current policy assumptions. Japan's ratio has been well above 200% for years, making it an outlier case that economists study closely. Italy, Greece, and several other eurozone members have also carried ratios above 100% for extended periods.
What makes the current moment distinctive is that this high-debt environment is now colliding with higher interest rates. When borrowing costs were near zero, carrying large debts was relatively cheap. As central banks raised rates to combat inflation — a shift that the Federal Reserve's rate decisions made tangible for millions of households — governments found themselves paying significantly more just to service existing debt, compressing the fiscal space available for everything else.
How the Debt-to-GDP Ratio Actually Works: The Mechanics Explained
The debt-to-GDP ratio works by dividing a government's total outstanding debt by the country's gross domestic product, then multiplying by 100 to express the result as a percentage. The formula is straightforward: if a country has $20 trillion in debt and produces $20 trillion worth of goods and services in a year, its ratio is exactly 100%.
What "Debt" Means in This Context
Government debt — sometimes called public debt or national debt — refers to the total amount of money a government owes to creditors. This includes bonds sold to domestic and foreign investors, borrowing from international institutions, and other financial obligations. It is important to note that different analysts measure this differently: some use "gross debt" (all liabilities), while others focus on "net debt" (liabilities minus financial assets held by the government). The IMF and the World Bank both publish regular debt figures, but comparing countries requires attention to which definition is being used.
What GDP Measures
Gross Domestic Product (GDP) is the total monetary value of all finished goods and services produced within a country in a specific time period, typically one year. It is the most widely used measure of an economy's size. A country with a large, fast-growing GDP can theoretically carry more debt than a smaller, stagnant economy, because the income base available to repay that debt is larger. This is the fundamental logic behind using GDP as the denominator: it provides context for the debt's scale.
The 100% Threshold: Where Does It Come From?
The 100% level is not a hard economic law — no statute or treaty declares a country insolvent the moment its debt exceeds its annual GDP. Instead, the threshold has taken on significance through a combination of research, historical patterns, and market psychology. A highly influential paper by economists Carmen Reinhart and Kenneth Rogoff, published by the National Bureau of Economic Research, argued that countries with debt-to-GDP ratios above 90% historically experienced slower economic growth. That research, despite later facing methodological scrutiny, embedded the idea of a danger zone in mainstream economic policy discussions.
Why Markets Pay Attention to Round Numbers
Market psychology adds its own layer of significance. When a country's ratio crosses 100%, bond investors, credit rating agencies, and financial analysts take notice — not because of any mechanical change, but because it signals that a government's debt now exceeds what its entire economy produces in a year. That perception can affect borrowing costs: investors may demand higher interest rates (called a risk premium) to compensate for the perceived increase in repayment risk, which in turn makes the debt more expensive to carry, potentially accelerating the very problem the market was worried about.
The Difference Between Stocks and Flows
One subtlety that trips up many readers: GDP is a flow (income generated over a year), while debt is a stock (accumulated obligations). Comparing a stock to a flow is like comparing your total credit card balance to your annual salary. A 100% ratio means the debt pile is as large as a full year's economic output — useful shorthand, but not a perfect analogy to household finances, since governments can tax, issue currency, and refinance indefinitely in ways individuals cannot.
Evidence, Counterarguments, and the Full Debate
Evidence on where exactly the danger zone begins — and whether 100% is truly special — is more mixed than a single dramatic headline suggests.
Japan is the most cited counterexample. Its debt-to-GDP ratio has remained above 200% for years without triggering the sovereign debt crisis that many analysts predicted. Japan's situation is unusual: most of its debt is held domestically by Japanese institutions and citizens, and the country runs its own currency, giving its central bank tools that eurozone members, for instance, do not have. The World Bank and IMF have both noted that the composition and currency denomination of a country's debt matters enormously, not just the headline ratio.
Greece, by contrast, experienced a severe debt crisis when its ratio climbed sharply, partly because it couldn't print its own currency within the eurozone and partly because a large share of its debt was held by foreign creditors who could rapidly pull back confidence. The contrast between Japan and Greece illustrates that context is everything.
The debate also extends to what governments do with borrowed money. Debt used to fund productive investment — infrastructure, education, technology — can generate future growth that makes the debt easier to repay. Debt used to fund current consumption without corresponding economic returns is harder to justify on efficiency grounds. How AI investment is shaping global growth trajectories is one contemporary example of how productive government and private borrowing can, in principle, generate returns that help sustain higher debt loads.
Perspective / Approach — Strengths — Trade-offs — Best Fit
High debt is manageable if growth is strong — Supported by Japan's experience; historically low crises among currency-sovereign nations — Assumes sustained growth and low rates; breaks down under external shocks — Large economies with domestic debt and own currency
100% is a meaningful danger signal — Backed by historical patterns of slowing growth and rising risk premiums — Oversimplifies; ignores debt composition, currency, and creditor base — Useful as a general policy warning, not a precise trigger
Context-dependent thresholds — Accounts for currency, maturity, creditor mix, and growth outlook — More complex; harder to communicate to the public or markets — Advanced economies with varied debt structures
Debt for investment vs. consumption — Focuses on return on borrowed funds; long-term fiscal health — Difficult to measure; political pressures often blur the distinction — Policymakers evaluating spending priorities
The mainstream view, reflected in IMF and World Bank assessments, is that there is no single universal threshold that applies to every country, but that higher debt ratios reduce fiscal flexibility, increase vulnerability to shocks, and tend to raise borrowing costs over time — particularly when debt is high relative to tax capacity or denominated in foreign currencies.
What Rising Debt-to-GDP Ratios Mean for the Future — and for You
The trajectory of debt-to-GDP ratios in most advanced economies is upward, driven by structural pressures that are unlikely to reverse quickly. Aging populations mean rising healthcare and pension costs. Higher interest rates mean servicing existing debt consumes a growing share of government budgets. Political gridlock in many democracies makes the kind of sustained fiscal consolidation that would meaningfully reduce ratios very difficult to achieve.
For everyday readers, the practical implications show up in a few important ways. When governments carry high debt and must pay more to service it, that money is not available for schools, infrastructure, healthcare, or tax cuts. Policymakers facing constrained budgets may reduce services, raise taxes, or inflate their way out of debt — each of which affects households differently. The risk of government shutdown episodes is one near-term symptom of the fiscal pressure that high debt-to-GDP ratios can generate when political agreement on budgets breaks down.
From a financial literacy standpoint, three takeaways stand out. First, the 100% threshold matters less as an absolute law and more as a warning signal about the direction of travel and the narrowing of options. Second, the story behind the ratio — who holds the debt, in what currency, at what interest rates — is as important as the number itself. Third, the cumulative effect of persistently high debt ratios is felt gradually, through slower growth, higher taxes, or reduced public services, rather than in a single dramatic event.
For people planning their financial lives, understanding these dynamics helps decode policy debates about government spending, tax policy, and interest rates — debates that directly affect mortgage rates, purchasing power, and the economic environment in which careers and savings plans unfold.
ALT: Visual comparison of debt-to-GDP ratios across major economies highlighting 100% threshold and fiscal sustainability debates
Q1: How is the debt-to-GDP ratio calculated in practice?
The debt-to-GDP ratio is calculated by dividing a government's total outstanding debt by the country's annual GDP, then multiplying by 100. For example, a government with $25 trillion in debt and a $25 trillion economy has a 100% ratio. Different organizations — the IMF, World Bank, and individual finance ministries — may use slightly different debt definitions (gross versus net), so comparing ratios across sources requires checking which measure is being used. The IMF's Fiscal Monitor publishes internationally comparable figures.
Q2: Is a high debt-to-GDP ratio always a sign of economic trouble?
A high ratio is not automatically a crisis signal — Japan has maintained a ratio above 200% for years without sovereign default. What determines whether a high ratio is dangerous includes who holds the debt (domestic versus foreign creditors), whether the debt is in the country's own currency, the pace of economic growth, and the government's revenue capacity. Ratios above 100% do, however, consistently reduce fiscal flexibility and make economies more vulnerable to external shocks, according to IMF and World Bank analyses.
Q3: How long does it typically take a country to reduce its debt-to-GDP ratio significantly?
Meaningfully reducing a debt-to-GDP ratio generally takes years to decades, depending on economic growth rates, fiscal discipline, and inflation. Countries can reduce the ratio by running budget surpluses (spending less than they collect), by growing their GDP faster than their debt accumulates, or through inflation, which erodes the real value of debt over time. Historical episodes of successful debt reduction, studied by the IMF and economic historians, typically required sustained political commitment and often favorable economic conditions lasting a decade or more.
Wrapping Up
The debt-to-GDP ratio is one of the most informative single numbers for understanding a country's fiscal health — but like all summary statistics, it tells part of the story rather than the whole picture. Three core points from this analysis are worth holding onto.
First, the ratio measures how large a government's debt is relative to the annual income of its entire economy, making it the most widely used benchmark for fiscal sustainability. Second, the 100% threshold is significant not as a mechanical trigger but as a psychological and analytical benchmark that markets and policymakers treat as a warning zone, particularly when debt is rising rather than stabilizing. Third, context determines risk: debt composition, currency denomination, creditor base, and growth trajectory all shape whether a high ratio is manageable or destabilizing — which is why Japan and Greece, both with elevated ratios at different points, had such different outcomes.
If you want to engage more confidently with financial and economic news, understanding how to decode a headline about government debt is a genuinely valuable skill. The next step is to keep building that foundation — moving from individual metrics to how they connect to interest rates, inflation, and the policy decisions that shape your economic environment.
Want to make sense of today's financial headlines without the jargon? Vega Brief breaks down complex economic, market, and personal finance news into clear, plain-English stories you can actually understand — backed by real sources and free from investment advice.
Sources
International Monetary Fund (IMF). "Fiscal Monitor — Public Debt Tracking and Projections".
https://www.imf.org
The World Bank. "Government Debt and Fiscal Sustainability Research".
https://www.worldbank.org
Congressional Budget Office (CBO). "Federal Debt and Budget Outlook".
https://www.cbo.gov
National Bureau of Economic Research (NBER). "Research on Public Debt and Economic Growth".
https://www.nber.org
Organisation for Economic Co-operation and Development (OECD). "General Government Debt Statistics and Fiscal Indicators".
https://www.oecd.org
Note: Standards may be updated; please check the latest official documents or consult professional advisors.
For educational purposes only. Not investment advice. We do not recommend any stock, fund, broker or trading platform. Headlines are sourced from Google News · Business; every story links to the original publishers.