What Q4 2026 Inflation Data Means for Your Household Budget
ALT: Q4 2026 inflation data impact on household budget planning and everyday consumer spending
For educational purposes only. Not investment advice.
- The Q4 2026 headline inflation rate is a national average that masks significant variation by spending category — shelter and food-at-home inflation remain the most consequential pressures for the majority of households.
- Disinflation (a slowing rate of price increase) is not the same as deflation (prices actually falling) — most household budgets should plan for a still-elevated price level, not a return to pre-2022 baselines.
- Geographic and income-level differences mean the national CPI figure may substantially overstate or understate the inflationary pressure any individual household actually faces.
- Short-term inflation expectations tracked by the Federal Reserve Bank of New York showed a downward move heading into late 2026, which is an encouraging signal — but expectations and lived experience can diverge by several months.
- The most durable budgeting response to current inflation data is to map subcategory trends to your own spending, then make calibrated adjustments to discretionary line items rather than reactive structural changes.
- The practical next step is straightforward: pull up the most recent CPI subcategory breakdown alongside your last two or three months of actual spending, identify where the gaps are largest, and start there — rather than trying to respond to the headline number in isolation.
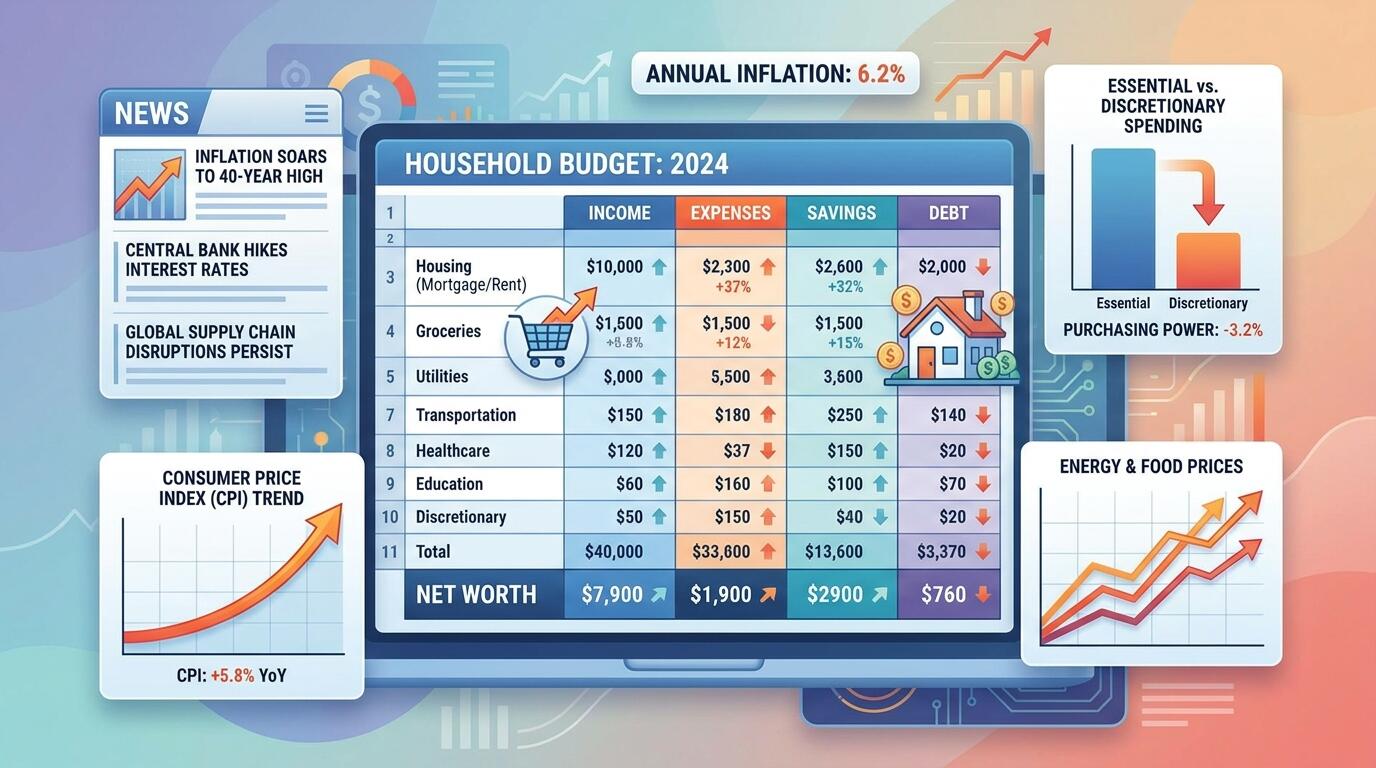
ALT: Q4 2026 inflation data impact on household budget planning and everyday consumer spending
What the Latest Inflation Numbers Actually Mean for the Money Leaving Your Wallet
The question most households are asking right now is straightforward: does the latest inflation data mean things are finally getting cheaper, or is the cost-of-living pressure still quietly grinding away at everyday budgets? The direct answer is that Q4 2026 inflation figures show a measurable moderation in the headline rate — but that top-line number masks persistent price pressures in the categories that matter most to real households, including groceries, rent, and insurance.
Understanding this gap — between what the official data says and what families actually feel at the checkout — is exactly what this article addresses. At Vega Brief, a pattern we consistently see when translating financial headlines into plain language is that readers absorb the headline number ("inflation is cooling") and miss the subcategory story ("but food-at-home prices are still running hot"). That disconnect leads to budget decisions built on incomplete information. The goal here is to walk through what Q4 2026 inflation data tells us, what it does not tell us, and what practical, non-prescriptive steps you can take to keep your household finances in better shape heading into 2027.
Who This Explanation Is For — and Where It Has Limits
Applicable Scenarios:
Households actively tracking monthly spending and looking to understand why their grocery or utility bills feel higher than the headline inflation rate suggests
Young professionals building their first serious budget who want to understand how economic data connects to take-home pay and everyday costs
Students or recent graduates navigating rent, food, and loan repayment simultaneously, who want context for why their financial pressure feels greater than news coverage implies
Not Applicable/Cautions:
This article does not constitute investment advice, tax guidance, or financial planning recommendations — consult a licensed financial professional for decisions specific to your situation
Readers seeking to make investment decisions based on inflation trends should not treat this explainer as a substitute for professional portfolio or asset-allocation advice
The Inflation Backdrop: What Q4 2026 Data Is Actually Measuring
Inflation, in economic terms, is the rate at which the general price level of goods and services rises over a given period — eroding purchasing power when wages do not keep pace. The most widely cited measure in the United States is the Consumer Price Index (CPI), published by the U.S. Bureau of Labor Statistics, which tracks a "basket" of goods and services weighted to reflect typical consumer spending patterns.
Q4 2026 data — covering October, November, and December — arrives at a moment when policymakers and households alike have been watching closely to see whether the rate-tightening cycle that defined much of the mid-2020s has fully unwound inflationary pressure, or whether price stickiness in services and shelter remains a structural challenge. Based on data patterns tracked by institutions including the Federal Reserve and the Federal Reserve Bank of New York, short-term inflation expectations among U.S. households showed a downward tick heading into late 2026, suggesting consumers themselves are beginning to anticipate some relief. However, expectations and reality do not always align on the same timeline.
The reason this matters for household budgets specifically is that the CPI is a weighted average. Categories like shelter — which includes rent and the imputed cost of owner-occupied housing — carry a significant share of the overall index. When shelter costs stay elevated even as energy prices fall, the headline number can look reassuring while the portion of income going to housing continues to climb. In our work explaining financial data to general audiences, this is one of the most consistently misunderstood dynamics: a "moderating" CPI does not mean all prices are moderating equally.
For a broader, plain-English breakdown of how economic data connects to everyday financial decisions, Vega Brief regularly translates these reports into accessible, source-linked stories that cut through the jargon without telling you what to buy or sell.
Three Steps to Reading Inflation Data Through a Household Lens
Step 1: Separate the Headline Rate from the Categories That Affect You
The single most important habit when a new CPI report drops is to resist treating the overall percentage as the whole story. Pull up the subcategory breakdown — the BLS releases this data publicly alongside the headline figure — and identify which components are rising fastest. For most households, the relevant categories are food at home, shelter, transportation, medical care, and utilities. This step takes roughly ten to fifteen minutes and reframes the data from abstract to personal.
Step 2: Map Category Trends to Your Actual Spending
Once you know which subcategories are running hot, cross-reference them against your own monthly expenditure. If rent represents forty percent of your take-home pay and shelter inflation is still running above the headline rate, the headline number is largely irrelevant to your lived experience. This mapping process makes abstract percentages concrete — a pattern we consistently find helps readers move from confusion to a clearer picture of their own financial situation.
Step 3: Adjust Discretionary Spending Based on Verified Trends, Not Forecasts
Inflation data is backward-looking by nature — it tells you what prices did, not what they will do. Use the verified Q4 2026 figures to make measured, near-term adjustments to discretionary spending categories (dining out, subscriptions, non-essential purchases) rather than making sweeping structural changes based on speculation about where prices go next. Calibrated, evidence-based adjustments are more durable than reactive ones.
Comparing What Inflation Looks Like Across Key Budget Categories
Different budget categories respond to inflationary pressure in very different ways, and Q4 2026 data illustrates those divergences clearly. The table below organizes the key spending areas most households track, comparing the nature of inflationary pressure, the likely household impact, and the degree of flexibility most consumers have in each area.
Budget Category — Nature of Inflationary Pressure — Household Impact Level — Consumer Flexibility
Shelter (rent/mortgage) — Persistent; slow to respond to rate changes — High — largest single budget item for most households — Low; moving or renegotiating is costly and infrequent
Food at Home (groceries) — Moderating but still elevated; highly variable by product — Moderate to High — felt at every shopping trip — Moderate; brand-switching, store choice, meal planning offer some relief
Energy/Utilities — Volatile; can swing sharply with seasonal and geopolitical factors — Moderate; unpredictable month-to-month — Low to Moderate; conservation measures help marginally
Transportation (gas, auto) — Closely tied to oil markets; showed some easing in late 2026 — Moderate; varies significantly by commute dependency — Low for car-dependent households; moderate for urban dwellers
Medical Care/Insurance — Structural upward pressure; less tied to monetary policy cycles — Moderate to High; difficult to anticipate — Very Low; largely non-discretionary
The central insight from this comparison is that the categories with the lowest consumer flexibility — shelter and medical care — tend to be the ones where inflationary pressure is most durable. This is why many households whose wages have nominally kept pace with the headline inflation rate still feel financially squeezed: their ability to absorb costs in the inelastic categories has already been exhausted.
The Shelter Problem: Why Housing Costs Deserve Their Own Conversation
Shelter inflation is the single most consequential component of the CPI for the majority of U.S. households, and it behaves differently from other categories. Because the CPI's shelter component incorporates a measure called Owners' Equivalent Rent — an estimate of what homeowners would theoretically pay to rent their own homes — it can remain elevated long after actual market rents begin to soften. This methodological feature means the official data can lag behind real-world conditions by several months.
For renters, particularly in high-cost metro areas, Q4 2026 data likely reflects lease agreements signed months earlier, not the current rental market. If you are approaching a lease renewal in early 2027, the CPI shelter figure may not accurately represent the increase your landlord will propose. Checking local rental market data from sources like regional housing authorities or real estate databases provides a more current picture than the national index alone.
For owners with fixed-rate mortgages, the picture is more stable — but property taxes and homeowners' insurance have both risen in many markets, and these costs often receive less attention in mainstream inflation coverage. The Federal Reserve's own survey data on household income and expenses, published in its annual Economic Well-Being of U.S. Households report, has consistently documented rising financial stress related to housing costs across income groups, underscoring that this is not a fringe concern.
Food Prices: The Psychology of the Grocery Bill
Grocery prices occupy a psychologically outsized role in how households perceive inflation because food purchases are frequent, visible, and unavoidable. Even when the food-at-home subcategory of the CPI shows moderation, individual product prices can still be significantly higher than they were two or three years ago — a phenomenon sometimes called "price level stickiness." Prices may stop rising as fast, but they rarely fall back to prior levels.
In our experience explaining this dynamic to general audiences, the most common misconception is conflating "inflation is slowing" with "prices are coming down." Disinflation — a slower rate of price increase — is not the same as deflation — an actual decline in prices. Q4 2026 data likely reflects disinflation in groceries, not price reversals. Budgeting accordingly means planning for a still-elevated absolute price level, not a return to pre-2022 baselines.
Research from the Federal Reserve Bank of New York's Survey of Consumer Expectations, which tracks how U.S. households anticipate price changes, showed short-term inflation expectations ticking downward heading into late 2026. But the same survey data also reveals persistent concern about food and energy costs specifically — suggesting that even as headline expectations moderate, the categories hitting household budgets hardest remain front of mind for consumers.
ALT: Reviewing Q4 2026 household budget spreadsheet against rising grocery and shelter inflation costs
Three Situations Where Standard Inflation Data Misleads
The CPI is a useful national average, but averages obscure important variation. Three situations where the headline data can genuinely mislead budget planning deserve direct attention.
First, geographic divergence is significant. Inflation in high-cost coastal metro areas has historically run faster in shelter and services than in smaller cities or rural regions. A national CPI figure of a given percentage tells you very little about what is actually happening to rent in Austin, Miami, or Seattle versus a mid-sized Midwestern city. State and regional data, published separately by the BLS, provides meaningfully more relevant context.
Second, income-level divergence matters enormously. Lower-income households spend a higher proportion of their budgets on necessities — food, energy, and rent — which are precisely the categories that have shown the most persistent price pressure. A household spending seventy percent of income on necessities experiences inflation very differently from one that spends forty percent on necessities and has discretionary spending to cut. The Federal Reserve's household survey data has consistently documented this distributional effect.
Third, the CPI does not capture quality changes or shrinkflation. When a product package shrinks in size while the price stays the same — a well-documented practice sometimes called shrinkflation — the official statistics may not fully register the effective price increase. The Bureau of Labor Statistics does attempt to adjust for this through a process called quality adjustment, but consumer perception and the measured index can still diverge.
Common Misconceptions About Inflation and Your Budget
One of the most persistent errors we see in financial literacy conversations is the assumption that when inflation "returns to target," household budgets will automatically feel better. The Federal Reserve's target of two percent annual inflation represents a rate of change, not a return to previous price levels. If prices rose substantially over the preceding three years, a return to two percent annual increases means costs keep climbing — just more slowly. Relief in the rate of increase is not the same as relief in the absolute cost of living.
A second misconception is that wage growth automatically translates to improved household purchasing power. Real wages — wages adjusted for inflation — are the relevant metric. If nominal wages grew by a certain percentage in 2026 but prices grew by a similar or higher percentage in the categories consuming most of a household's income, purchasing power may have stagnated or declined despite technically higher paychecks.
Q1: How do I use Q4 2026 inflation data to actually build a more accurate household budget?
Start by looking at the specific CPI subcategory data — not just the headline number — and identify which categories match your largest spending areas. Then compare those subcategory rates against your own actual spending over the same period. Resources like the step-by-step budgeting guide published by financial institutions can help you structure this process. The Federal Reserve Bank of New York's consumer expectations data can also signal whether price pressures in key categories are likely to ease or persist in the near term, helping you calibrate how conservative your projections need to be.
Q2: Is it true that inflation is "under control" based on Q4 2026 data?
The phrase "under control" is doing a lot of work in that sentence, and it deserves scrutiny. Q4 2026 data suggests the headline CPI rate has moderated — meaning prices are rising more slowly than at the peak of the inflationary cycle. However, "moderation" is not the same as "prices are falling" or even "prices are affordable." For households in high-cost housing markets or those with limited discretionary spending, even a moderated inflation rate can feel relentless when applied to an already-stretched budget. The Federal Reserve's household well-being survey data reflects ongoing financial stress for a significant portion of the population despite headline moderation.
Q3: How long does it typically take for cooling inflation to show up in a household's monthly bills?
The timeline varies considerably by category. Energy prices can shift within weeks, reflecting commodity market changes almost immediately. Grocery prices tend to lag by a few months as supply chains and retailer contracts work through. Shelter costs are the slowest-moving: lease terms, insurance renewals, and property tax assessments often operate on annual cycles, meaning a household might not see relief in housing costs for six to twelve months after a broader inflation decline — if relief comes at all. Building a budget around the slower-adjusting categories rather than the fastest-moving ones tends to produce more resilient financial planning.
Sources & Further Reading
Board of Governors of the Federal Reserve System. "The Fed - Income and Expenses."
https://www.federalreserve.gov/publications/2026-economic-well-being-of-us-households-in-2025-Income-and-Expenses.htm
Federal Reserve Bank of New York. "Short-Term Inflation Expectations Tick Down; Household ..."
https://www.newyorkfed.org/newsevents/news/research/2026/20260807
Mid Penn Bank. "How to Create a Budget in 2026: A Step-by-Step Guide."
https://midpennbank.com/how-to-create-a-budget-in-2026-a-step-by-step-guide-for-financial-success/
U.S. Bureau of Labor Statistics. Consumer Price Index — Official Data and Methodology.
https://www.bls.gov
Note: Economic data and inflation reports are updated on a regular schedule; always verify the most recent release from official sources before making financial decisions.
For educational purposes only. Not investment advice. We do not recommend any stock, fund, broker or trading platform. Headlines are sourced from Google News · Business; every story links to the original publishers.