Why Markets Are Reacting to This Quarter's Inflation Data
ALT: Stock market charts reacting to quarterly inflation data and Federal Reserve signals
For educational purposes only. Not investment advice.
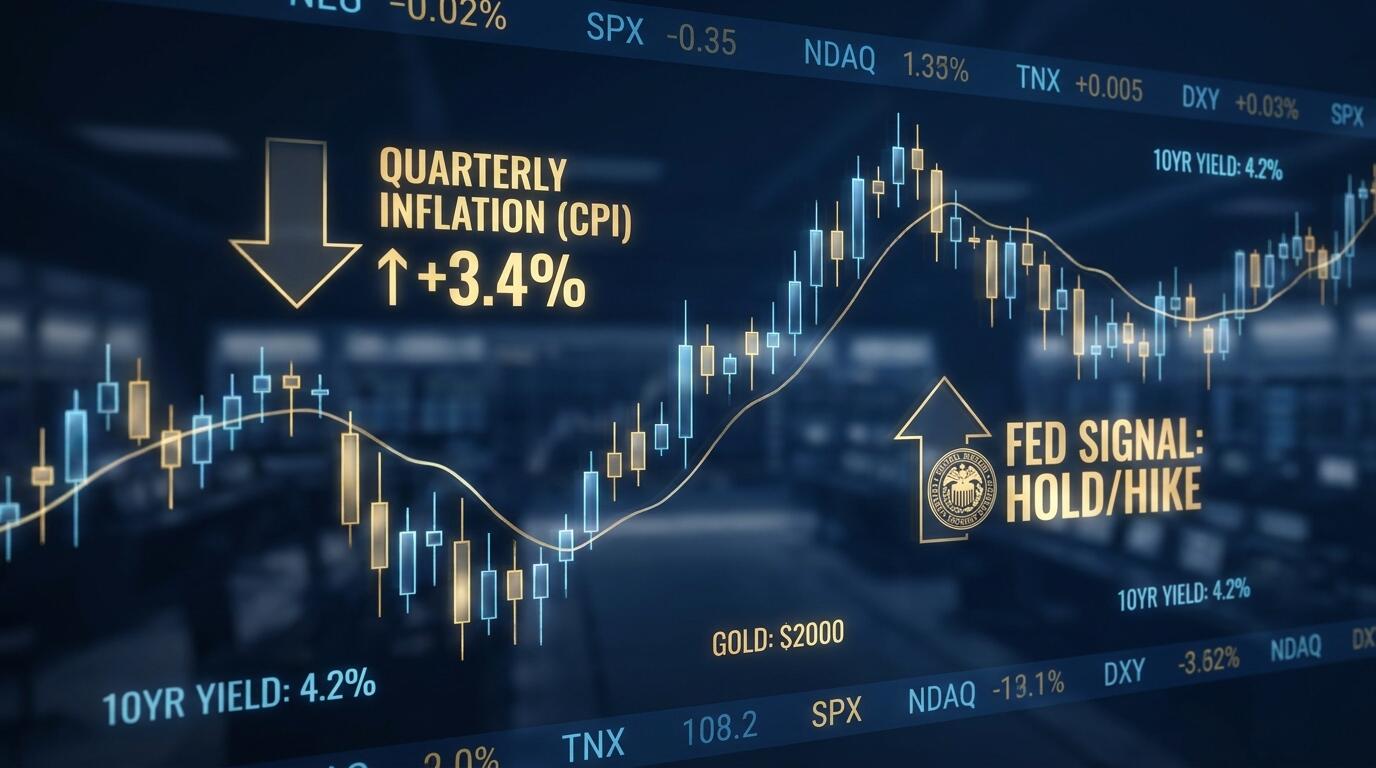
ALT: Stock market charts reacting to quarterly inflation data and Federal Reserve signals
What This Quarter's Inflation Numbers Actually Mean for Markets
Every quarter, a single data release has the power to send stock markets lurching, shift bond yields overnight, and reshape expectations for millions of borrowers. This quarter's inflation data is doing exactly that — and understanding why requires more than glancing at a headline number. The core question readers are asking right now is simple: why does a percentage-point shift in the Consumer Price Index trigger such visible volatility across asset classes? The direct answer is that inflation data doesn't just describe the economy's past — it shapes the entire financial system's expectations about the future, particularly about what central banks will do next.
This topic deserves a deeper look right now because inflation trends are at an inflection point. After years of elevated price pressures, markets are parsing every new data release for clues about whether the tightening cycle is truly over or whether another surprise could keep borrowing costs high. For everyday readers — renters, students carrying loans, young professionals investing for the first time — the stakes are genuinely personal, even if the news coverage often makes it feel abstract.
How We Got Here: The Inflation Backdrop Behind the Market Reaction
Inflation, in its most straightforward definition, is the rate at which the average price of goods and services rises over time. When inflation is high, each dollar buys less; when it falls back toward a central bank's target, purchasing power stabilizes. What makes this quarter's data significant is its position within a longer economic story that began with pandemic-era supply disruptions, followed by aggressive monetary policy tightening across major economies.
For the better part of the past several years, central banks — led by the U.S. Federal Reserve — raised interest rates at a pace not seen in decades. The rationale was straightforward: higher borrowing costs cool consumer spending and business investment, which in turn relieves pressure on prices. That strategy appeared to work, at least partially. Headline inflation fell meaningfully from its peak, and markets began pricing in the prospect of rate cuts. But the descent has not been smooth, and "sticky" inflation in categories like services, housing, and insurance has kept policymakers cautious.
This quarter's inflation reading arrives at a delicate moment. Core inflation — the measure that strips out volatile food and energy prices to reveal underlying trends — has not fallen as quickly as many analysts anticipated. According to the U.S. Bureau of Labor Statistics, which publishes the Consumer Price Index monthly, services inflation in particular has remained elevated, driven largely by shelter costs and wage-sensitive industries. When the latest figures confirmed this stickiness, markets reacted with immediate and visible unease.
The context matters beyond U.S. borders, too. The European Central Bank and the Bank of England are navigating their own inflation trajectories, and global bond markets are closely interconnected. Rising yields in one major economy tend to pull capital and influence expectations elsewhere. Understanding that inflation data is now a globally synchronized signal — not just a domestic economic footnote — is essential for grasping the scale of the market reaction readers are witnessing.
The Mechanics of the Market Reaction: Why Inflation Numbers Move Prices
Market participants don't react to inflation data in isolation. They react to how the new data compares with their prior expectations — and then immediately recalibrate their models for future central bank decisions, corporate earnings, and asset valuations. Here is how each major market channel responds, and why.
Bond Markets and Interest Rate Expectations
Bond markets are the fastest and most direct responders to inflation surprises. When inflation comes in higher than expected, bond investors demand higher yields to compensate for the erosion of their fixed returns. Bond prices and yields move inversely — so a spike in yields means bond prices are falling. Longer-dated government bonds, such as the U.S. 10-year Treasury, are especially sensitive because their value depends heavily on expectations about where interest rates will sit over a decade.
This quarter, yields moved noticeably when the inflation report landed. That repricing in bond markets then ripples outward. The 10-year Treasury yield is widely used as a benchmark for mortgage rates, corporate borrowing costs, and the discount rates applied in stock valuations. When it shifts, almost every other asset class feels it. For a deeper look at how the Federal Reserve's current rate decisions affect your mortgage and savings, the mechanics are similar: the path of official rates drives long-term borrowing costs across the economy.
Equity Markets and the Valuation Reset
Stock markets react to inflation data through a specific financial logic. The value of a company's stock is theoretically the sum of its future earnings, discounted back to today using a rate that reflects the risk-free return available (typically tied to government bond yields). When inflation data pushes bond yields higher, that discount rate rises — which mathematically reduces the present value of future corporate earnings. The result: stocks fall, often sharply, even when there's nothing wrong with the companies themselves.
Growth stocks and technology shares tend to be most sensitive to this dynamic because a greater share of their value is tied to earnings expected far in the future. By contrast, value stocks and certain sectors like energy or financials can be more resilient — and sometimes even benefit — when rates and yields rise. A pattern consistently observed in market analysis is that the equity sell-off following an inflation surprise is often led by exactly these rate-sensitive sectors.
Currency Markets and Capital Flows
Currency markets also reprice quickly in response to inflation data. When inflation remains elevated and markets conclude that a central bank will keep rates higher for longer, the currency of that country often strengthens. Higher interest rates attract foreign capital seeking better returns, increasing demand for that currency. A stronger dollar, for example, makes U.S. exports more expensive abroad and can squeeze the earnings of multinational companies that generate revenue in weaker foreign currencies — adding another layer to the equity market impact.
Consumer Sentiment and the Soft-Data Channel
Beyond the hard numbers in financial markets, inflation data influences what economists call "soft data" — surveys of consumer and business confidence. When inflation prints above expectations, headlines follow. Consumers who read those headlines may tighten spending, and businesses may delay investment decisions. This behavioral channel is slower-moving than bond or stock market repricing, but it is real and measurable, and it feeds back into actual economic outcomes over subsequent quarters.
Evidence From Multiple Angles: How Different Observers Read the Same Data
The same inflation report can look very different depending on which lens you apply. This is not spin — it reflects genuine complexity in economic data that even professional economists debate in real time.
From a monetary policy perspective, central bank officials at the Federal Reserve — as documented in Federal Open Market Committee meeting minutes and public statements — have emphasized that they need sustained evidence of disinflation before reducing rates. A single quarter of sticky core inflation reinforces a "higher for longer" stance, which markets have had to absorb repeatedly over the past year.
From an equity investor's perspective, the reaction depends on whether inflation is sticky because of strong demand (relatively positive for corporate revenue) or because of constrained supply and rising costs (negative for margins). This quarter's mix appears to lean toward the cost-push side in several categories, which complicates the earnings outlook. The investment implications of sustained AI-related capital expenditure — which has been propping up growth in certain sectors — add another layer of nuance. As explored in analysis of how AI investment is shaping global growth trajectories, technology spending has created pockets of resilience even in a tighter rate environment.
From a fixed-income perspective, bond market participants are weighing whether this quarter's data represents a genuine reversal in the disinflation trend or a temporary blip. That distinction has enormous implications for the trajectory of yields and, therefore, for borrowing costs across the economy.
The table below captures how these perspectives diverge and where each carries trade-offs:
Perspective / Approach — Strengths — Trade-offs — Best Fit
Monetary policy (central bank) — Focused on long-run price stability; data-driven — Slow to respond; backward-looking by design — Assessing rate path over 6–18 months
Equity market analysis — Forward-looking; incorporates earnings and valuations — Can overreact to short-term data surprises — Understanding sector rotation and stock moves
Fixed-income / bond market — Most direct link to rate expectations; highly liquid — Yields can overshoot on sentiment — Gauging borrowing cost trends
Consumer behavior lens — Captures real-world spending shifts — Slower to manifest; harder to measure precisely — Understanding medium-term demand trends
ALT: Quarterly inflation report impact on bond yields, equity markets, and Federal Reserve interest rate expectations
The divergence across these perspectives is itself important information. When bond markets, equity markets, and consumer surveys are all pointing in different directions, it signals that uncertainty is elevated — and elevated uncertainty tends to mean more volatility, not less, until the picture clarifies.
Where Things Go From Here: The Outlook and What It Means for Readers
The most important question after digesting this quarter's inflation data is not what happened — it is what happens next. Markets are currently engaged in a genuine debate about the most likely path forward, and the evidence supports several plausible scenarios rather than one obvious outcome.
If inflation continues to prove stickier than expected in the quarters ahead, the Federal Reserve is likely to maintain its cautious posture. That would mean interest rates staying elevated for longer, which translates into continued pressure on mortgage rates, auto loans, and credit card costs for everyday borrowers. It would also keep bond yields elevated, creating ongoing headwinds for rate-sensitive equity sectors.
If, on the other hand, the current quarter's data proves to be a temporary bump and subsequent readings show a resumed downward trend, markets would likely reprice quickly — rallying on the anticipation of rate cuts. Bond yields would fall, mortgage rates could ease, and growth-oriented stocks would likely benefit most from the resulting lower discount rates.
The honest assessment is that neither scenario is certain. What is certain is that inflation data will remain the single most market-moving economic release for the foreseeable future. Understanding how to read it — and why markets react the way they do — gives readers a meaningful edge in making sense of financial headlines.
For those tracking how this plays out across different income groups, the implications of sustained inflation on government benefit adjustments are also worth watching. The mechanics of how Social Security cost-of-living adjustments are calculated are directly tied to inflation measurements — a concrete example of how abstract-sounding economic data translates into real dollar amounts for real people.
Practically speaking, readers who understand the inflation-market connection are better positioned to:
Recognize why their savings account rates, mortgage offers, or loan refinancing options are shifting
Contextualize stock market swings without assuming a crisis or a recovery that hasn't arrived
Follow Federal Reserve communications with enough background to understand what policymakers are actually signaling
Ask better questions when advisors, employers, or news anchors discuss economic conditions
Q1: How does the Consumer Price Index actually get calculated?
The Consumer Price Index, published monthly by the U.S. Bureau of Labor Statistics, measures the average change in prices paid by urban consumers for a representative basket of goods and services. The basket includes categories such as food, housing, transportation, and medical care, weighted by how much of their income households typically spend in each area. When the index rises more than expected in a given month or quarter, it signals that inflationary pressure is persisting — which directly affects Federal Reserve policy decisions and, in turn, financial markets.
Q2: Is the stock market's reaction to inflation data always immediate?
The sharpest market reactions to inflation data typically occur within minutes of a report's release, particularly in bond and currency markets, which are highly liquid. Equity markets often follow within the same trading session. However, the full adjustment can play out over days or weeks as investors, analysts, and portfolio managers update their models, revise earnings forecasts, and rebalance allocations. In periods of high uncertainty, a single report can trigger multiple waves of repricing rather than one clean, immediate move.
Q3: When do central banks typically respond to new inflation data, and how long does it take to affect the real economy?
Central banks like the Federal Reserve review inflation data at scheduled policy meetings, which occur roughly every six to eight weeks. However, the real-economy effects of any rate decision — whether a hike or a cut — typically take six to eighteen months to work through borrowing costs, business investment, and consumer spending patterns. This time lag is why markets react immediately to inflation data even when an official rate change is months away: investors are pricing in what they expect policymakers to decide, not waiting for the decision itself.
Final Thoughts
Inflation data is not just a number for economists. It is the signal that drives interest rates, borrowing costs, stock valuations, and the purchasing power of everyday people. This quarter's figures have reminded markets — and readers — that the path back to stable, low inflation is rarely straight.
Key Takeaways:
Inflation data moves markets because it shapes expectations about what central banks will do next, not just because it describes past prices.
Bond markets react first and fastest, and the resulting yield moves ripple into mortgage rates, stock valuations, and currency markets.
Sticky inflation in services and shelter has been the primary driver of market anxiety this quarter, reflecting costs that are slower to respond to higher rates.
Different market participants read the same data differently — understanding those competing interpretations reduces the confusion that comes from watching markets move in seemingly contradictory directions.
The outlook remains genuinely uncertain, and that uncertainty itself is a meaningful piece of market information worth tracking.
The clearest next step for any reader who wants to stay ahead of these developments is to build a habit of following inflation data in context — not just the headline number, but the underlying components and the market reaction. That habit, built over time, transforms financial news from noise into signal.
Want to actually understand what's happening in the markets and economy — without drowning in jargon? Visit Vega Brief for plain-English explainers on the financial headlines that matter most to you. Every story is AI-assisted, source-linked, and strictly educational, so you can stay informed and think for yourself.
References
U.S. Bureau of Labor Statistics. "Consumer Price Index."
https://www.bls.gov
Board of Governors of the Federal Reserve System. "Federal Open Market Committee."
https://www.federalreserve.gov
International Monetary Fund. "World Economic Outlook."
https://www.imf.org
U.S. Department of the Treasury. "Interest Rate Statistics."
https://www.treasury.gov
Note: Economic data and policy positions are subject to revision; please check the latest official publications for the most current figures and guidance.
For educational purposes only. Not investment advice. We do not recommend any stock, fund, broker or trading platform. Headlines are sourced from Google News · Business; every story links to the original publishers.